
Executive Summary
I wrote a stock trading system. It trades NYSE and NASDAQ stocks long-only, using Zorro and IB. It appears to be profitable in backtests, and it passed a reality test suggested by Johann Christian Lotter. Licenses for sale.
Disclaimers
Before we begin, I have some obligatory reminders:
- Historical backtest performance does not imply future live trading performance.
- Trading stocks is inherently risky.
- Trading with a margin account can result in losses greater than your original investment.
The Challenge
I was approached by a client to develop a trading system. He had some basic requirements:
- It must be legal for a USA resident to trade with the system, and
- It must be appropriate for an account size of $100,000 USD or higher.
After many development iterations, constructive criticism, and reality tests, we ended up with a respectable system that he was willing to purchase a license for. This system is code-named the Don System.
The Don System
The Don System invests in stocks long-only on a weekly rotation. Its rules are very simple:
- Stock selection rules:
- No ETF’s allowed.
- All stocks shall be ordinary equity stocks from NYSE and NASDAQ.
- All stocks shall be relatively liquid. Some stocks were eliminated during the due diligence phase of system development.
- Entry and exit rules:
- Once a week, perform a stock position rotation.
- Invest long in proportion to Rate of Change of stock price.
- Limit number of open positions as optimized.
- Only the strongest positive ROC stocks remain open. The rest will have closed positions.
- Risk management rules:
- Monitor for drawdowns and margin calls tick-for-tick.
- On excessive drawdown or margin call, close all losing positions and keep open all winning positions.
And that’s it!
Parameter Configuration
The system was trained with brute force to configure a total of four system-wide variables, all of which were related to risk and margin management and number of positions opened. In other words, entry signals were not trained so as to avoid overfitting.
Here are the four variables:
- Number of assets allowed to trade in the market at a time
- Nominal margin consumed (assuming Leverage = 2)
- Max portfolio allocated to any given asset
- Max portfolio excursion
As of this writing, I have trained it for Margin T accounts (Leverage = 2) only. Further work will be needed to optimize for Leverage=1 (cash/retirement) and Portfolio Margin (Leverage = 6) accounts. I might look into this if there’s enough demand for it.
The parameters were trained on 2009 through 2016 data. All of my Out-of-Sample (OOS) tests begin in 2017.
Backtest Performance
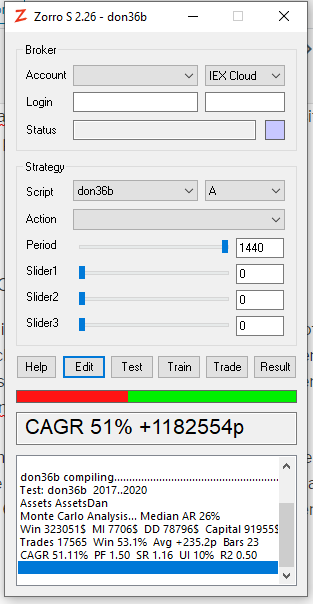
I just updated the OOS period to range from January 2017 through early July 2020, so you can see the effects of the little market crashes on my trading system, including the coronavirus crash, below.
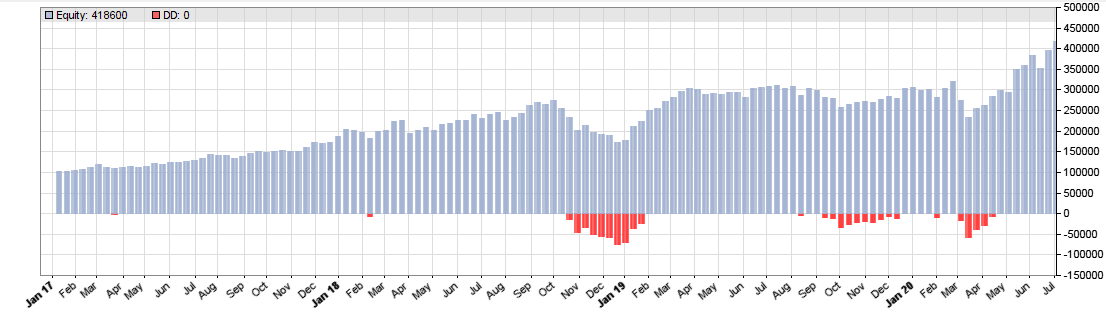
According to the OOS backtest, the Compounding Annual Growth Rate (CAGR) is about 51%. The simulated $100k Margin T account grows to about $400k over the course of about 3.5 years.
I should note that the date range of the OOS has a large effect on the CAGR value. If my memory serves me well, I have seen it range from 20% in a bad market to 60% in a good market, with the OOS test spanning a minimum of two years. After all, it is leveraged.
Due Diligence
Skepticism is a virtue in the trading business. Many oversights are possible when developing a trading system. For the Don System, I trained very few parameters, so I mostly needed to check that it wasn’t pure luck that the OOS tests were doing so well.
For advice, I turned to Johann Christian Lotter, blogger at financial-hacker.com, author of The Black Book of Financial Hacking, and the chief engineer of Zorro.
His advice:
“If it’s portfolio rotation, first do a test with detrended price curves, then compare with a series of tests with detrended and shuffled price curves. This way you’ll get a z-score of the system. If the z-score is low enough, like 5%, you have a winner.”
I did exactly as he said. My trading system, using detrended real price curve data, outperformed my system being used on randomly generated price curves 99.2% percent of the time out of 1000 samples. This suggests that the good OOS performance of my system is not a random coincidence.
To summarize the iterations:
- First backtest: +22.58% CAGR (detrended).
- Random backtest percentiles:
- 0: -49.14% CAGR
- 25: -23.58% CAGR
- 50: -16.32% CAGR
- 75: -8.05% CAGR
- 99: +18.96% CAGR
- 100: +95.26% CAGR
- p = 0.008 (We outperformed 99.2% of iterations)
Implementation Details
The trading system includes a fully-integrated AlphaVantage daily history downloader. It costs zero dollars to get all required historical data for this trading system.
For live trading, it connects to Interactive Brokers via the API. The system was explicitly designed to be the only trading system on the account. This way, it can monitor positions for any outliers and make some necessary counteractions.
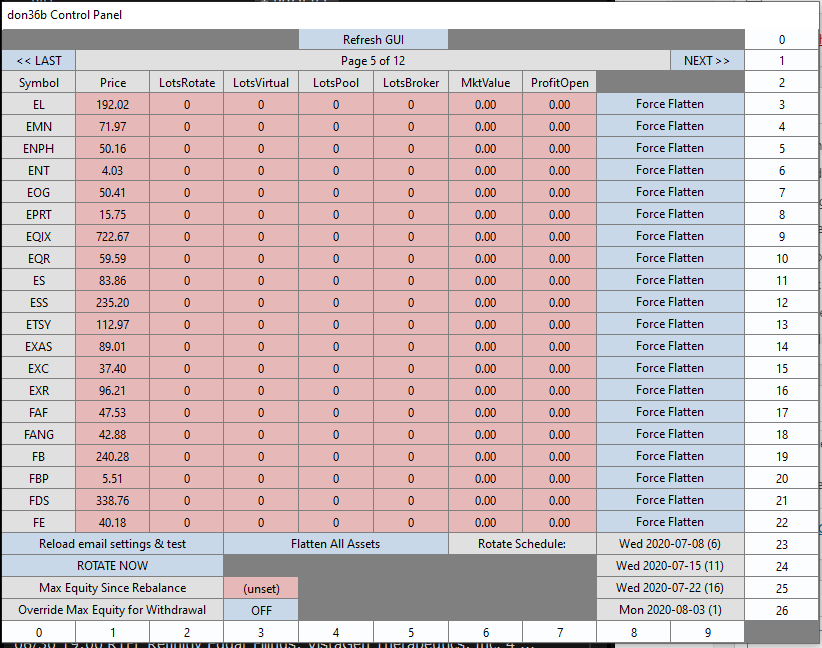
It has a custom GUI that allows the user to check up on the status of all of the positions for each stock symbol. There’s an emergency button that closes the position of a particular symbol by force.
Included is an emailer. It submits emails for status reports and distress signals.
The Trading Edge
The Don System is a brutally simple, yet relatively stable trading system backed by risk management. My research suggests that it survives on a long term basis. And interestingly, the backtests exhibit some good rebound performance after a market drawdown.
Inquiries
I am accepting any inquires about the Don System. Binary and source licensing is available. Custom implementations are negotiable. Pricing varies based on supply and demand.
Comments locked due to spam.
im interested in your software
i use zorro and ib also
Thanks. Requests for quote can be sent to my email: andrew@vitaltrades.com